Introduction
The world of short-term rentals, bolstered by platforms like Airbnb and VRBO, has emerged as an exciting investment opportunity in the real estate industry. But, like any investment, it’s not without risks. Understanding market trends, property values, rental rates, and occupancy rates can help you make informed decisions and maximize returns. This is where data comes in.
In this article, we’ll walk you through a detailed, data-driven analysis of short-term rental markets across the United States. We’ll uncover key trends, identify standout markets, and reveal important correlations that can guide your investment strategy. But don’t worry, you won’t need a degree in data science to follow along. We’ll break down complex terms and present findings in an easy-to-understand manner.
Getting Familiar with the Data
Before we dive into the analysis, let’s familiarize ourselves with some of the key terms and indicators used in this dataset:
- Year over Year Home Value Change (YoY Home Value Change): This represents how much home values have increased or decreased compared to the same period last year. A positive percentage means values have gone up; a negative percentage means they’ve gone down.
- Average Home Price: This is the average price of homes in a specific market.
- Active Rentals: The number of properties listed for rent in a market.
- Average Daily Rate (ADR): The average price per night for a rental property.
- Occupancy Rate: The percentage of time that rental properties are occupied.
- Annual Revenue: The total rental income generated from a property in a year.
- Gross Yield: This is a profitability metric calculated as the annual revenue divided by the average home price.
- Cap Rate: This is another profitability metric, often used in real estate investing, which takes into account property operating expenses.
- Change in Supply: This shows how the number of active rentals has increased or decreased over a certain period.
We started by combining data from multiple sheets into a single dataset. This dataset spans from April 2023 to June 2023 and covers 93 unique markets in 28 different states. Source data goes back to Q4 of 2019 from the data providers.
Methodology
Our team of experts analyzes public data sources, including Chalet and Zillow, among others, to identify markets that offer high profitability and strong potential for growth. In this article, we will share our findings for the best markets to invest in short-term rentals in 2023 based on our latest research.
While the analysis above provides a strong starting point for short-term rental investors, it’s important to note that real estate investment is never purely based on numbers alone. For this analysis in particular we are putting emphasis on the gross yield metric.
Gross Yield = Annual Revenue / Home Purchase Price
Beyond just the gross yield, you should note that there are a variety of factors that should be taken into consideration when making an investment decision, such as the location of the property, the condition of the property, local regulations and taxes, and local market trends.
Key Insights from Descriptive Statistics
Descriptive statistics help us understand the general characteristics of our data. Here are some key findings:
- The YoY Home Value Change ranges from a decrease of 12.6% to an increase of 13.7%, with an average increase of 2.6%.
- The average home price in these markets varies greatly, with the cheapest market at $98,708 and the most expensive at $1,692,370.
- The number of active rentals varies from 510 to an impressive 34,532 in some markets.
- The average daily rate for a rental property ranges from $115 to $672, depending on the market.
- Occupancy rates, which are crucial for generating consistent rental income, vary between 36% and 83%.
Uncovering Correlations
Correlation is a statistical measure that describes the degree to which two variables move about each other. By understanding correlations, we can identify relationships between different market variables.
For instance, we found that markets with more active rentals in the past tend to have more active rentals now. This makes sense as areas popular for short-term rentals likely remain popular over time. Also, we found that markets with higher rental rates and more active rentals tend to generate more revenue. This insight can help investors choose markets that promise higher rental income.
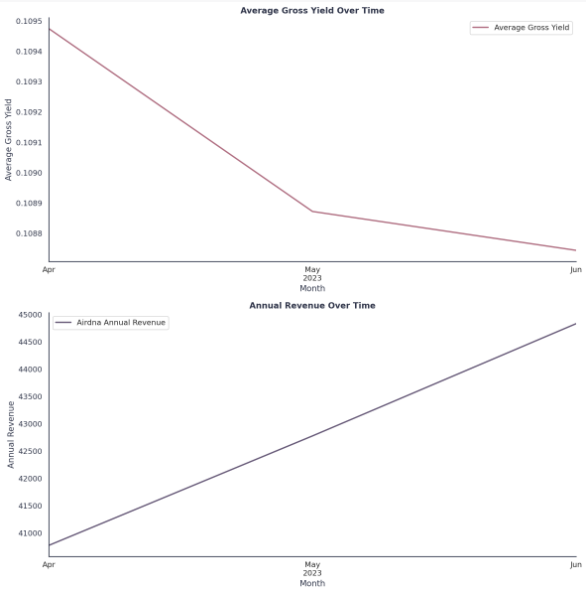
Looking at how key metrics have changed over time, we found that the average gross yield has decreased slightly over April, May, and June 2023. This could be due to an increase in home prices or a decrease in rental rates. On the other hand, both the annual revenue and cap rate increased slightly over these months, indicating improved profitability.
Tracking Trends Over Time
Looking at how key metrics change over time can help us identify trends. Here’s what we found:
- The average gross yield tends to decrease slightly over April, May, and June 2023. This could be due to an increase in home prices or a decrease in rental rates.
- On the other hand, the Chalet annual revenue and cap rate tend to increase slightly over these months, indicating improving profitability in these markets.
Identifying Outliers and Standout Markets
An outlier is a data point that differs significantly from other similar points. Identifying outliers can help us spot markets that are performing exceptionally well or poorly.
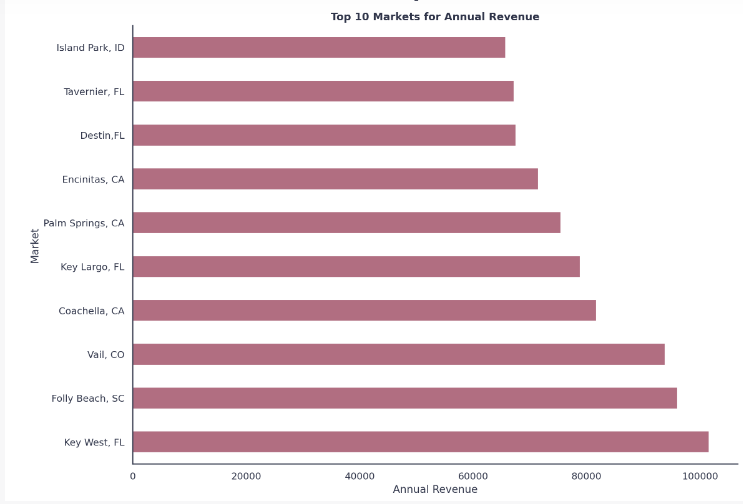
In our analysis, ‘Broken Bow, OK’ emerged as an outlier with a significantly high average gross yield, while ‘Key West, FL‘, ‘Folly Beach, SC‘, and ‘Vail, CO‘ stood out with significantly high Chalet annual revenue. These markets could offer unique investment opportunities, although further investigation is needed to understand the reasons behind their exceptional performance.
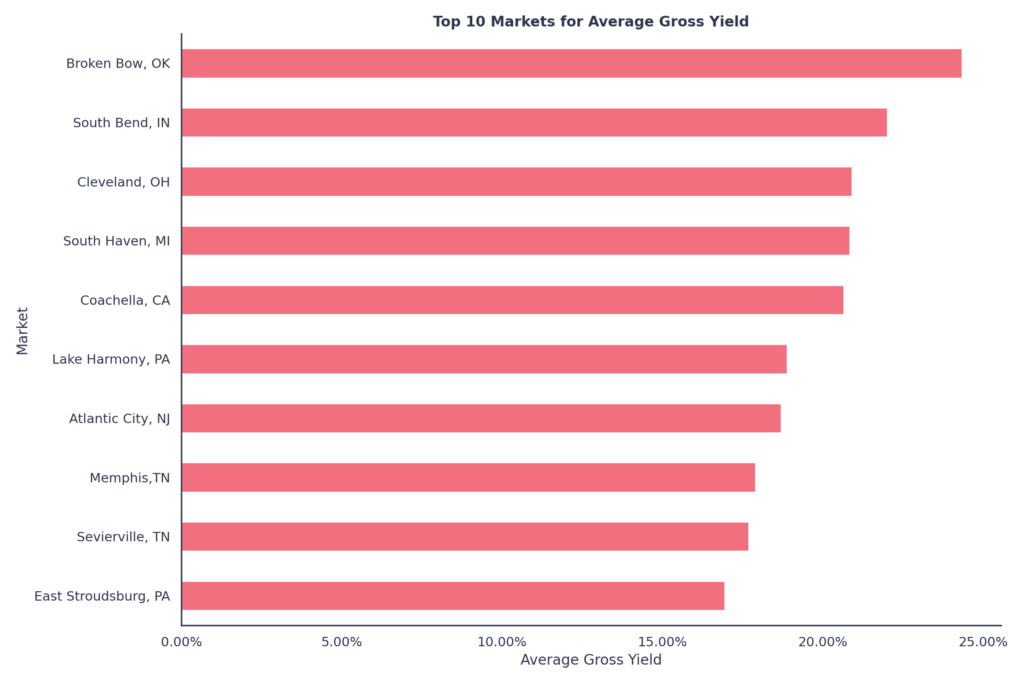
When we looked at average gross yield and annual revenue at a market level, we found that the top-performing markets are mostly located in the states of Tennessee, Oklahoma, Indiana, Colorado, Florida, and California. This suggests that these states might offer promising investment opportunities.
Top 100 Airbnb Rental Markets

Instantly compare the top 100 short-term (Airbnb) rental markets in the US
Changes in Gross Yield and Occupancy Rates
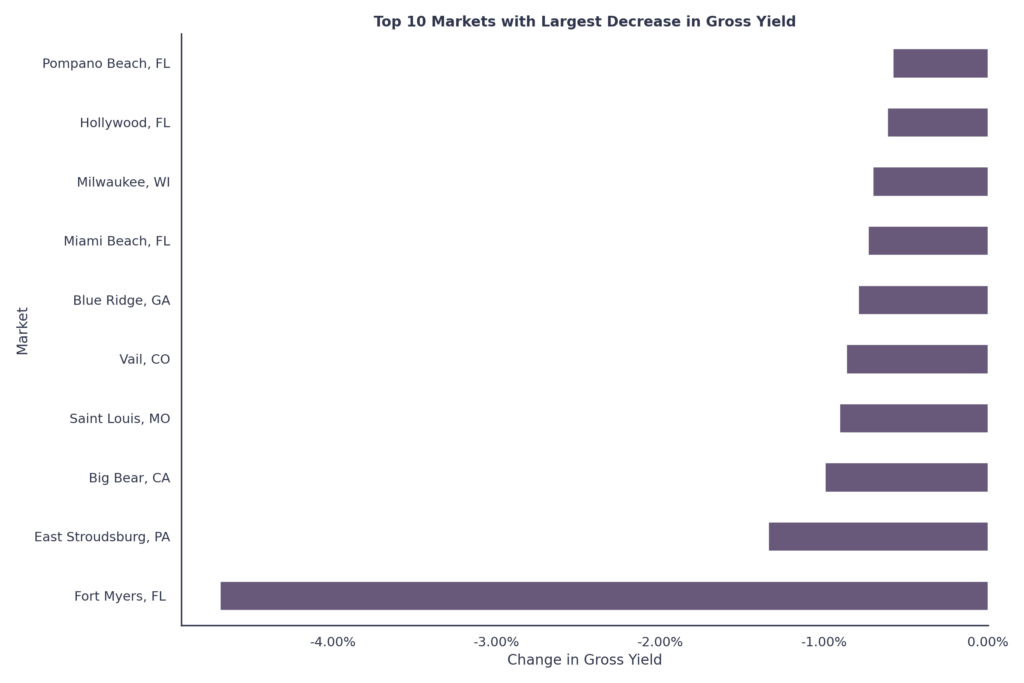
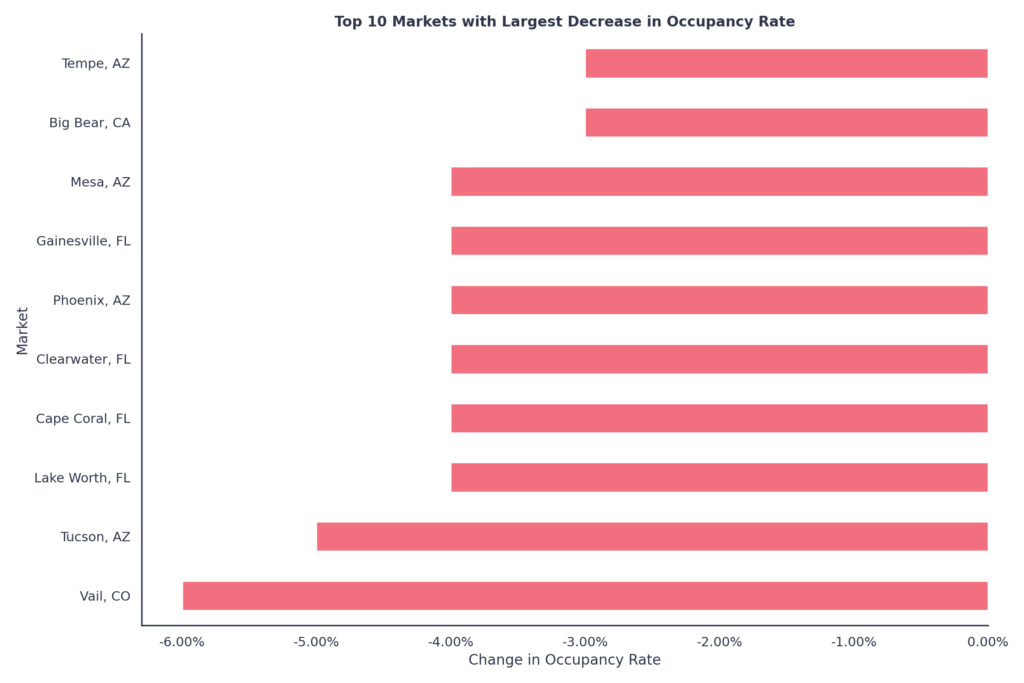
We also investigated the markets with the largest decreases in gross yield and occupancy rates from April to June 2023. ‘Fort Myers, FL’ saw the biggest decrease in gross yield, while ‘Vail, CO’ had the largest drop in occupancy rate. These decreases could be due to a variety of factors, including seasonal trends, changes in local regulations, increased competition, or economic conditions.
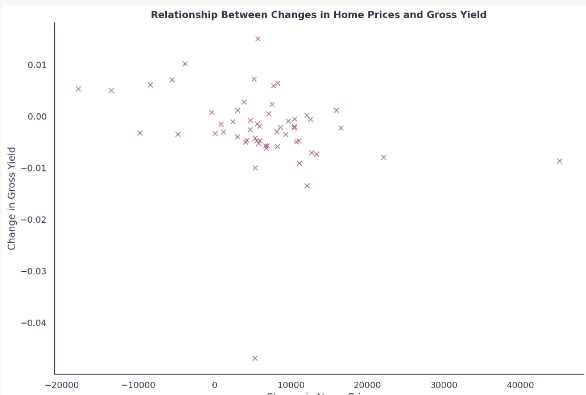
Exploring the Relationship Between Home Prices and Gross Yield
This is because the gross yield is calculated as the annual revenue divided by the home price. So, if the home price increases while the annual revenue remains constant, the gross yield would naturally decrease. This insight could help investors balance the potential gains from property appreciation with the returns from rental income.
We further analyzed the relationship between the increase in average home price and the decrease in gross yield. We found a weak negative correlation, indicating that as the average home price increases, the gross yield tends to decrease slightly.
Markets with Growing Revenue
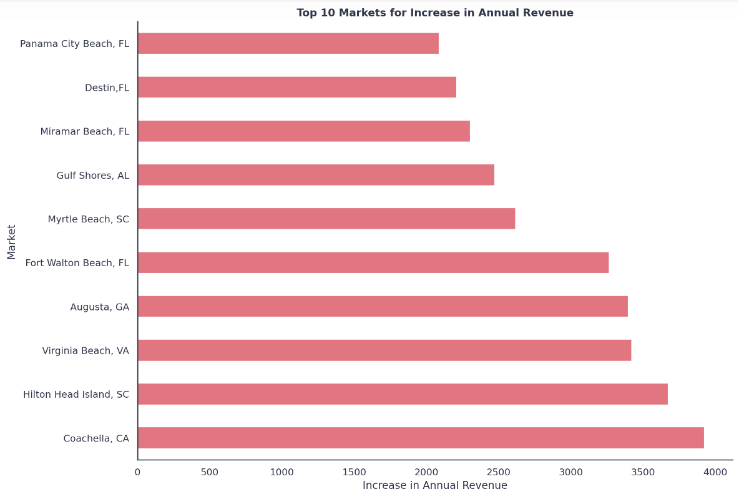
Finally, we identified the markets and states with the biggest increase in annual revenue from April to June 2023. ‘Coachella, CA’ and the state of California saw the biggest increases, suggesting a positive trend for short-term rentals in these areas. However, more research would be needed to validate this trend and assess potential risks.
Conclusion
Data-driven insights can guide investors toward more profitable decisions in the short-term rental market. While high gross yields like in Broken Bow, OK and increasing annual revenues are attractive, it’s important to also consider other factors such as home prices, occupancy rates, and market stability. Furthermore, while increasing home prices might lead to a decrease in gross yield, this correlation is weak and other factors may also influence the yield. Therefore, investors need to consider a holistic picture of the market dynamics before making an investment decision.
Remember, while data provides a strong foundation for decision-making, it’s only part of the puzzle. Successful investing also requires timely information, in-depth market knowledge, and sound judgment. Happy investing!